
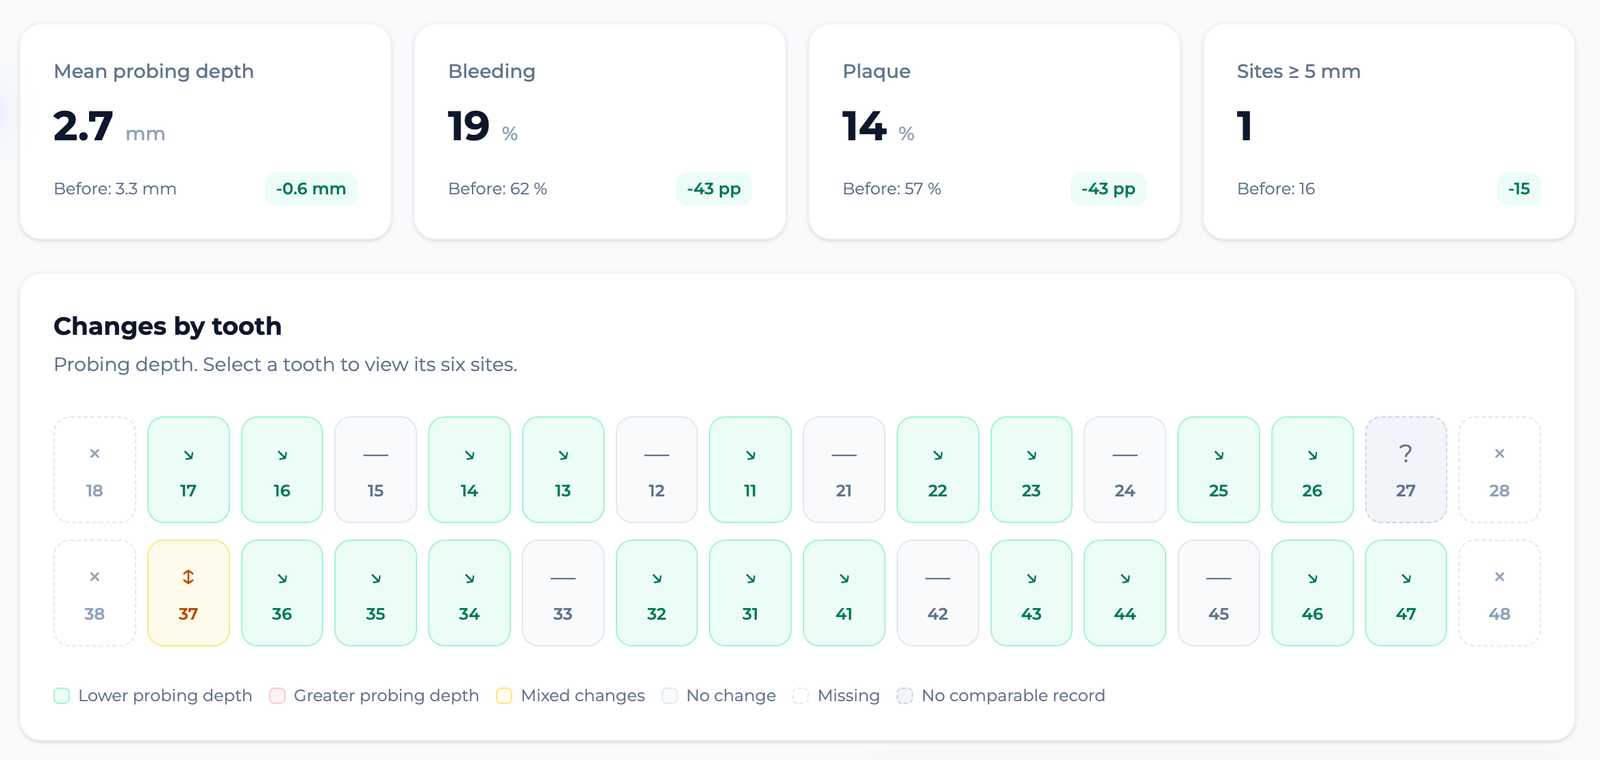
Start with the indicators.
The Comparisons view brings together mean probing depth, bleeding percentage and plaque percentage, alongside their changes from another record. This overview helps locate differences that deserve closer review.
A mean summarizes data; it does not describe every site. The number of recorded teeth or sites can differ between examinations, so two averages may represent different sets of observations. Interpret each indicator alongside its underlying record.
Continue by tooth and site.
The tooth-level overview helps you locate changes and choose where to review the detail. The screenshots show visual categories including lower depth, greater depth, mixed changes, no change, missing teeth and no comparable record.
These categories are not interchangeable. A missing tooth is not a healthy site, and a non-comparable record does not demonstrate stability. Review needs to retain that distinction instead of converting every empty entry to zero.
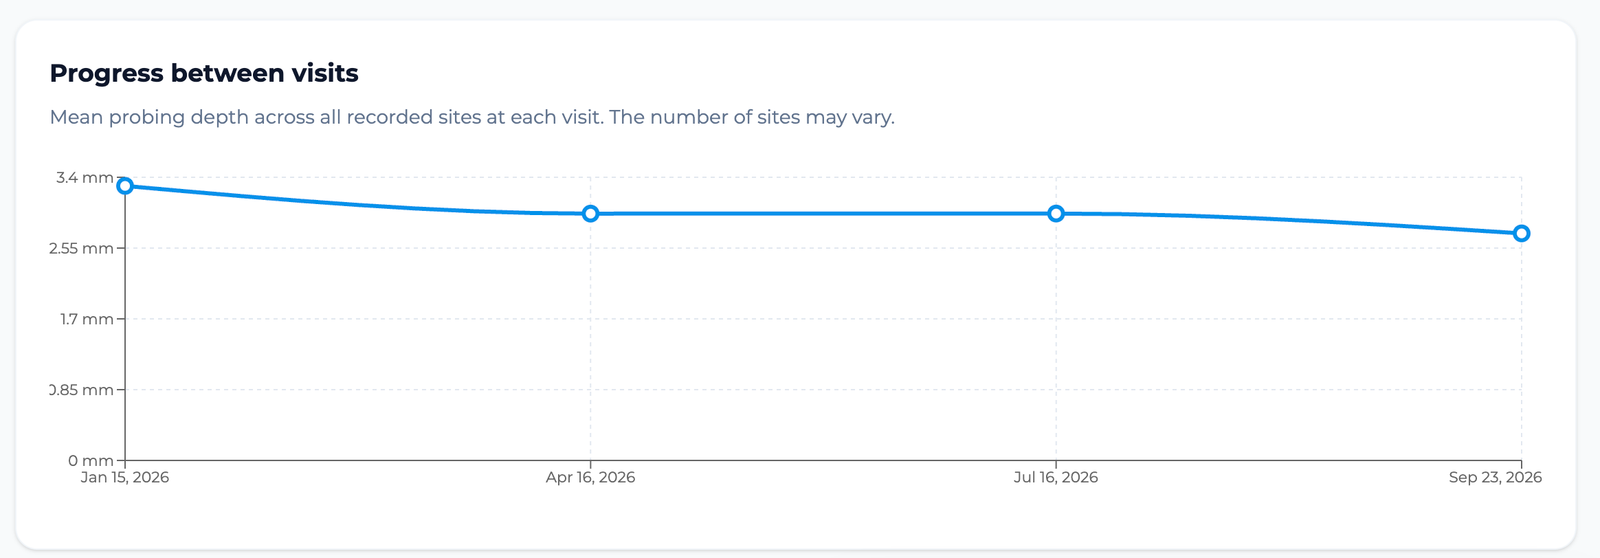
Follow progress across visits.
The progress graph shows recorded values over time. Before interpreting a trend, check dates, present teeth, implants and the set of included sites. Changes in any of these can affect the comparison.
PerioVox uses AI to identify and highlight changes in periodontal charts. The visualization supports review; it does not by itself establish a cause, treatment response or prognosis.
Keep the clinical context.
The initial record provides a reference for future visits. The professional determines what to document and how to interpret changes.
- Confirm that you are comparing the correct patient and visits.
- Identify missing teeth, implants and data without an equivalent in the other visit.
- Check the summary against tooth- and site-level values.
- Relate differences to the examination and clinical history.
Frequently asked questions
What does PerioVox compare?
Review periodontal charts from different visits, including probing depth, bleeding and plaque indicators, changes by tooth and progress over time.
Does a lower mean prove that every site improved?
No. A mean is a summary. Review site-level values and changes in the dataset before interpreting it.
Can I export the records?
Yes. Export periodontal charts as CSV for case review, audits and research.
Information for dental professionals. Records and support tools require clinical review; they do not replace diagnosis or treatment decisions.